All the way up till today.
I know, it doesn’t look like I didn’t write, but I certainly didn’t.
All the posts between the 11th of August (Complete the opposite) and this one are written today. The reason for this? Too busy, no internet, computer not charged, not a lot of pictures, etc etc.
At the moment me and WRT are on our own. Lawrance is off to Scotland. Time for me to do my Self Assessment for HMRC (two days ago), do the accounts (yesterday) and catch up with our adventures (today).
What I did do while we were still cruising, though, was the statistics.
First this year’s map. The parts in green are our travels on a river.
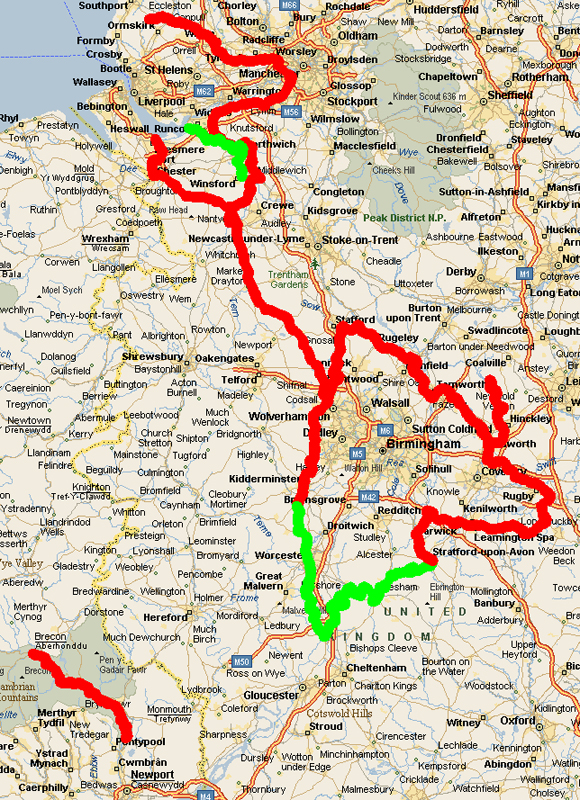
Summer Cruise 2017
| Days out | 152 |
| Cruising days | 92 |
| Cruising every | 1.65 day |
| Cruising time | 333.5 hours |
| Cruising hours per day | 3.63 |
| Total miles | 655 |
| Miles per day | 7.12 |
| Miles per days out | 4.31 |
| Locks | 312 |
| Locks per day | 3.39 |
| Bridges | 18 |
| Bridges per day | 0.2 |
| Shortest day | 00:45 Bird in Hand to Stourport Basin |
| Longest cruising day | 8:45 hrs Llanfoist to Talybont-on-Usk |
So we were away almost for the same amount of days (159 in 2016 (without the time spent in the caravan while WRT got her make-over)), of which we cruised more days (2016: 85). We cruised for just a bit less hours (2016: 351) but covered more miles (2016: 585). We’ve done less locks (2016: 509) and bridges (2016: 29), but, except for the locks at the Stratford Canal I managed to do all the locks I had to do.
This year the shortest day was longer (2016: 00:30 Banbury to Banbury), and the longest day shorter (2016: 10:45 hrs Wigan to Slipway).
I know, once an accountant, always an accountant. So now I have to look at all the numbers and find explanations for the differences…